Non-Gaussian distributions#
So far, you have seen that we can use a parametric distribution to model the uncertainty in our observations. Also, you have revisited one of those parametric distributions, the Gaussian distribution, which is a widely used model since it has lots of applications such as modelling natural processes or measurement errors. Here, we will discuss an interesting property of this distribution, the lack of asymmetry, and introduce the concept of the tail of the distribution.
Concepts of asymmetry and tail of the distribution#
Asymmetry is a relevant property of a distribution which analyzes its shape. In the Figure below, you have the PDF of a Gaussian distribution.
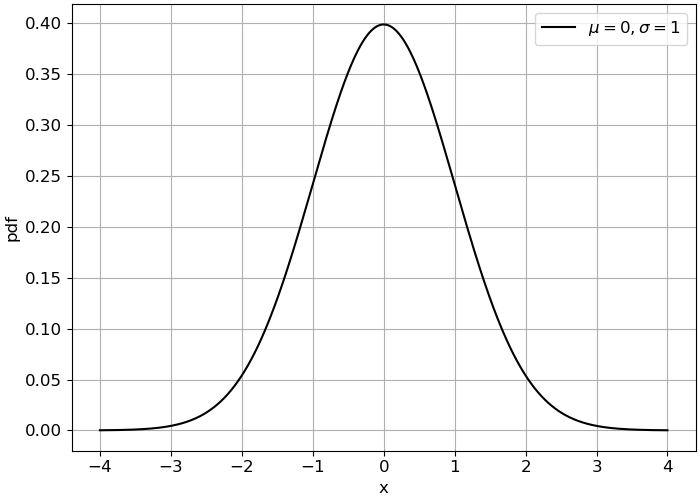
Fig. 5.9 Gaussian PDF.#
As you can see, the shape of the PDF is perfectly symmetric with respect to the mode1 of the distribution. This leads to an interesting property: for perfectly symmetric distributions the mode, mean2 and median3 have the same value.
As you can imagine, it is also possible to analyze the asymmetry of an empirical distribution. To this end, we can visually inspect the empirical PDF and compute the sample coefficient of skewness from a set of observations as
where \(x_i\) are the observations, \(\overline{x}\) is the mean of the observations, \(n\) is the number of observations, and \(\sigma\) is the standard deviation.
And what happens when my observations are not symmetric?
In that case, Gaussian distribution may not be the most appropriate model and we need to look for a different model. Actually, it is very common to find asymmetric distributions when modelling natural processes!
If we go back to the wind data that we previously introduced and have a look at the PDF, we can easily notice that it is not symmetric. The mass in the PDF is not distributed equally at both sides of the mode. Actually, the shape is similar to a bell with the center around \(W_s = 5m/s\), but we can see that the distribution expands towards the positive values creating what we call the tail of the distribution. Since the tail expands towards positive values, we say that the PDF has positive skewness.
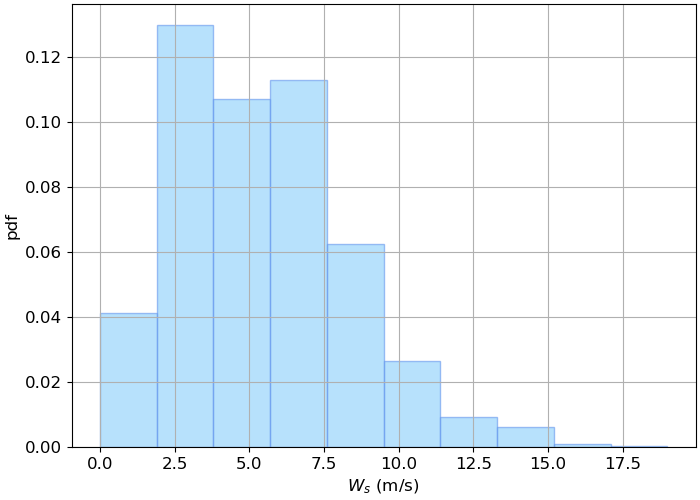
Fig. 5.10 Empirical probability density function of the wind speed data.#
Many natural phenomena present positive skewness. This means that the mode, the mean and the median do not have the same value anymore. For a positively skewed PDF: mode < median < mean. This inequality is reversed if the PDF is negatively skewed.
And why are asymmetry and tail that important?
As you can imagine, asymmetry is an important criteria when selecting the parametric distribution to model the uncertainty in our observations. The shape of the parametric distribution needs to fit the shape of the empirical distribution function.
Moreover, the tail of the distribution is modelling the highest and lowest values of our variable and, typically, they are the ones we use for design. For instance, if we are designing a building, we would be interested in the high wind speeds that it has to withstand (loading conditions). Also, if we are considering the nutrients required to cultivate mussels, we would analyze the lowest values to ensure that the mussels have enough food to survive. Thus, it is important to choose a parametric distribution which is able to model the behavior in the tail when the observations are not symmetric.
In the following sections, we will introduce some common parametric distributions, as well as their characteristics, to give an overview of some possible models you may apply to model your data. But keep in mind that the list is not exhaustive, there are a lot of distributions!
Attribution
This chapter was written by Patricia Mares Nasarre and Robert Lanzafame. Find out more here.
- 1
The mode is the most frequently observed value and, thus, the value of the distribution with the highest value of the density in its PDF.
- 2
Visually from the PDF, we can define the mean as the value of the random variable which is the balance point of the distribution.
- 3
Visually from the PDF, we can define the median as the value of the random variable which divides the PDF in two areas of the same value.